(Go To: Top | General Summary | Monthly Report | Daily Summary | Hourly Summary | Domain Report | Organization Report | Failed Referrer Report | Referring Site Report | Browser Report | Browser Summary | Operating System Report | Status Code Report | File Size Report | File Type Report | Directory Report | Request Report)
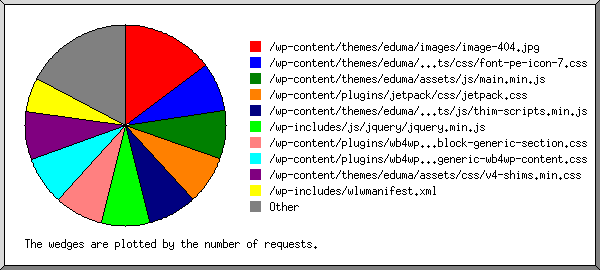
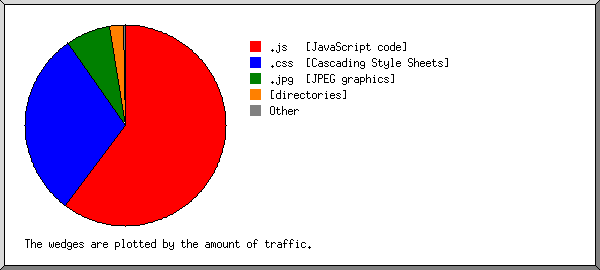
Listing files with at least 20 requests, sorted by the number of requests.
| #reqs | %bytes | last time | file |
|---|
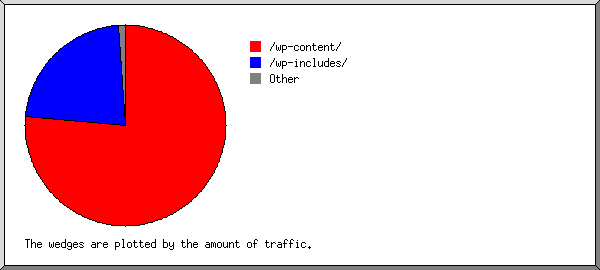
| 61 | 7.22% | Apr/30/22 8:12 AM | /wp-content/themes/eduma/images/image-404.jpg |
| 32 | 1.95% | May/ 3/22 2:16 AM | /wp-content/themes/eduma/assets/css/font-pe-icon-7.css |
| 32 | 1.95% | May/ 3/22 2:16 AM | /wp-content/themes/eduma/assets/css/font-pe-icon-7.css?ver=5.9.2 |
| 32 | 34.33% | May/ 3/22 2:16 AM | /wp-content/themes/eduma/assets/js/main.min.js |
| 32 | 34.33% | May/ 3/22 2:16 AM | /wp-content/themes/eduma/assets/js/main.min.js?ver=4.5.8 |
| 32 | 20.86% | May/ 3/22 2:16 AM | /wp-content/plugins/jetpack/css/jetpack.css |
| 32 | 20.86% | May/ 3/22 2:16 AM | /wp-content/plugins/jetpack/css/jetpack.css?ver=10.7 |
| 32 | 4.59% | May/ 3/22 2:16 AM | /wp-content/themes/eduma/assets/js/thim-scripts.min.js |
| 32 | 4.59% | May/ 3/22 2:16 AM | /wp-content/themes/eduma/assets/js/thim-scripts.min.js?ver=4.5.8 |
| 32 | 21.23% | May/ 3/22 2:16 AM | /wp-includes/js/jquery/jquery.min.js |
| 32 | 21.23% | May/ 3/22 2:16 AM | /wp-includes/js/jquery/jquery.min.js?ver=3.6.0 |
| 32 | 0.85% | May/ 3/22 2:16 AM | /wp-content/plugins/wb4wp-wordpress-plugin-bluehost-production/build/block-generic-section.css |
| 32 | 0.85% | May/ 3/22 2:16 AM | /wp-content/plugins/wb4wp-wordpress-plugin-bluehost-production/build/block-generic-section.css?ver=29ffbded135d1e494ff0b47bd8c692ad |
| 32 | 0.17% | May/ 3/22 2:16 AM | /wp-content/plugins/wb4wp-wordpress-plugin-bluehost-production/build/block-generic-wb4wp-content.css |
| 32 | 0.17% | May/ 3/22 2:16 AM | /wp-content/plugins/wb4wp-wordpress-plugin-bluehost-production/build/block-generic-wb4wp-content.css?ver=2f8a878f4dd2fcda1a03625eadc65afd |
| 32 | 6.33% | May/ 3/22 2:16 AM | /wp-content/themes/eduma/assets/css/v4-shims.min.css |
| 32 | 6.33% | May/ 3/22 2:16 AM | /wp-content/themes/eduma/assets/css/v4-shims.min.css?ver=4.5.8 |
| 23 | 0.18% | May/ 2/22 4:16 PM | /wp-includes/wlwmanifest.xml |
| 71 | 2.27% | Apr/29/22 4:00 PM | [not listed: 55 files] |
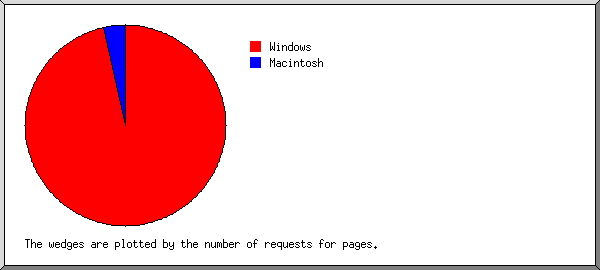
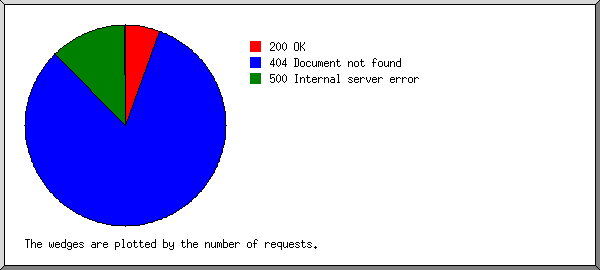
 Web Server Statistics for edtechplusnew-org.lhe.jpt.mybluehost.me
 ) represents 2 requests for pages or part thereof.